

- Home
- INTERMEDIATE ALGEBRA
- Course Syllabus for Algebra I
- Mid-Plains Community College
- FRACTION OF A WHOLE NUMBER
- Systems of Linear Equations
- MATH FIELD DAY
- Course Outline for Finite Mathematics
- Calculus
- Algebra Final Examination
- Math 310 Exam #2
- Review of Trigonometric Functions
- Math 118 Practice test
- Precalculus Review
- Section 12
- Literal Equations
- Calculus Term Definitions
- Math 327A Exercise 2
- Public Key Algorithms II
- Maximizing Triangle Area
- Precalculus I Review for Midterm
- REVIEW OF A FIRST COURSE IN LINEAR ALGEBRA
- Math 6310 Homework 5
- Some Proofs of the Existence of Irrational Numbers
- ALGEBRAIC PROPERTIES OF MATRIX OPERATIONS
- Math 142 - Chapter 2 Lecture Notes
- Math 112 syllabus
- Math 371 Problem Set
- Complex Numbers,Complex Functions and Contour Integrals
- APPLICATIONS OF LINEAR EQUATIONS
- Week 4 Math
- Fractions
- Investigating Liner Equations Using Graphing Calculator
- MATH 23 FINAL EXAM REVIEW
- Algebra 1
- PYTHAGOREAN THEOREM AND DISTANCE FORMULA
- Georgia Performance Standards Framework for Mathematics - Grade 6
- Intermediate Algebra
- Introduction to Fractions
- FACTORINGS OF QUADRATIC FUNCTIONS
- Elementary Algebra Syllabus
- Description of Mathematics
- Integration Review Solutions
- College Algebra - Applications
- A Tip Sheet on GREATEST COMMON FACTOR
- Syllabus for Elementary Algebra
- College Algebra II and Analytic Geometry
- Functions
- BASIC MATHEMATICS
- Quadratic Equations
- Language Arts, Math, Science, Social Studies, Char
- Fractions and Decimals
- ON SOLUTIONS OF LINEAR EQUATIONS
- Math 35 Practice Final
- Solving Equations
- Introduction to Symbolic Computation
- Course Syllabus for Math 935
- Fractions
- Fabulous Fractions
- Archimedean Property and Distribution of Q in R
- Algebra for Calculus
- Math112 Practice Test #2
- College Algebra and Trigonometry
- ALGEBRA 1A TASKS
- Description of Mathematics
- Simplifying Expressions
- Imaginary and Complex Numbers
- Building and Teaching a Math Enhancement
- Math Problems
- Algebra of Matrices Systems of Linear Equations
- Survey of Algebra
- Approximation of irrational numbers
- More about Quadratic Functions
- Long Division
- Algebraic Properties of Matrix Operation
- MATH 101 Intermediate Algebra
- Rational Number Project
- Departmental Syllabus for Finite Mathematics
- WRITTEN HOMEWORK ASSIGNMENT
- Description of Mathematics
- Rationalize Denominators
- Math Proficiency Placement Exam
- linear Equations
- Description of Mathematics & Statistics
- Systems of Linear Equations
- Algebraic Thinking
- Study Sheets - Decimals
- An Overview of Babylonian Mathematics
- Mathematics 115 - College Algebra
- Complex Numbers,Complex Functions and Contour Integrals
- Growing Circles
- Algebra II Course Curriculum
- The Natural Logarithmic Function: Integration
- Rational Expressions
- QUANTITATIVE METHODS
- Basic Facts about Rational Funct
- Statistics
- MAT 1033 FINAL WORKSHOP REVIEW
- Measurements Significant figures
- Pre-Calculus 1
- Compositions and Inverses of Functions
Maximizing Triangle Area
Following is the problem we worked on early this year in Precalculus:
Take a sheet of paper and fold the
upper left corner so that it touches
some point on the bottom edge, as
illustrated here. Consider the area of
the triangle labeled “A” – the one
formed in the lower left corner of the
paper. Find the dimensions of the
triangle that has the largest area.
Students worked in groups to collect data; each group had different-sized sheet
of paper.
Expectations included a written report that included both a “data solution” and
an “algebraic
solution.” This talk looks at those solutions, plus extensions involving more
data analysis and
calculus.
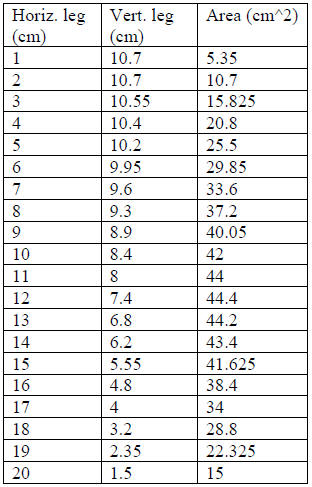
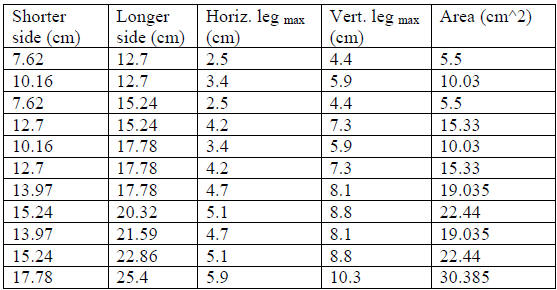
Let’s begin with a sample data set collected from folding an 8.5” x 11” sheet of
paper:
And some plots of our data:
Area (cm^2) vs. Horiz Leg (cm)
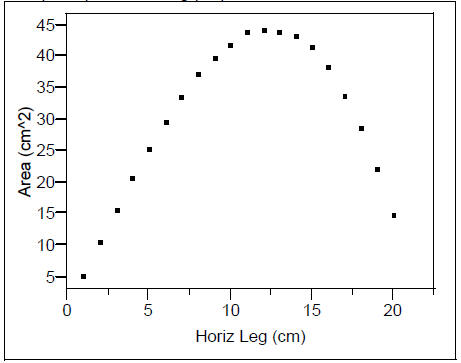
Area (cm^2)
By inspecting our data and scatterplot, we see the maximum area is approximately
44.4 cm^2,
when the dimensions are approximately 12 cm x 7.4 cm.
What functions best describe the relationships in the scatterplots above?
Quadratic? Some other
polynomial? Something else? (Will revisit this question soon…)
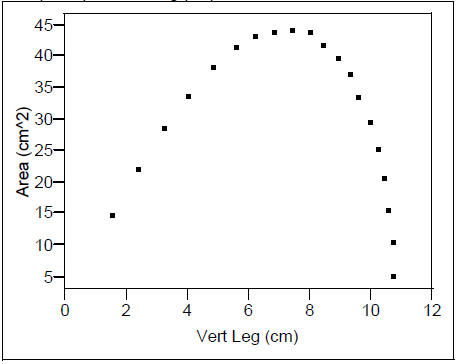
Or, can we predict the vertical leg length if we know the horizontal leg length?
Vert Leg (cm) vs. Horiz Leg (cm)
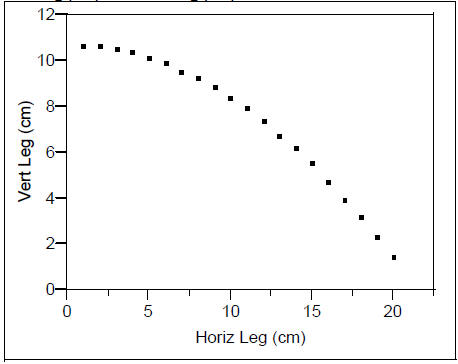
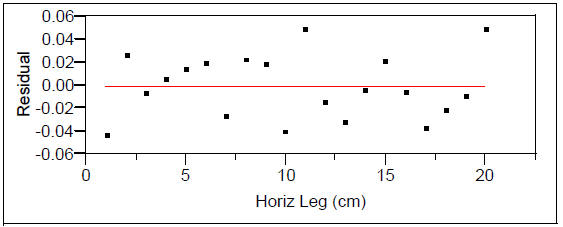
Seems to be parabolic? (The quadratic fit on the next page seems promising – the
residuals show
no obvious pattern!)
Bivariate Fit of Vert Leg (cm) By Horiz Leg (cm)
Polynomial Fit Degree=2
Vert Leg (cm) = 10.7646 - 0.000571 Horiz Leg (cm) - 0.023314 (Horiz Leg (cm))^2
So, we could write  , and with
 , we
, we
have  . (Where
 and
and  are
the vertical
are
the vertical
and horizontal legs of the triangle, respectively.) Then if we graph this
function, we notice it
matches our “area vs horiz. leg” scatterplot well and we can use our calculator
to find the
maximum area of 44.56 cm^2, with a horiz. leg length of 12.4 cm. Then
(12.4)= 7.18 cm
would be the vertical leg length.
What about domain?
Notice that our model A(h) (as given above) is a cubic polynomial. Polynomials
have domains
of all real numbers, but is this a sensible domain in the context of our
problem? It would only
make sense to have A(h)> 0, and a quick inspection reveals that for this to be
the case, we must
have 0 <h< 21.5 (approximately). (Why 21.5? Notice this is approximately the
shorter
dimension of the sheet of paper.)
Algebraic Approach
Realizing that the hypotenuse of our right triangle is simply the difference
between the shorter
side of the sheet of paper and the triangle’s vertical leg, we can label our
figure as such:
Then starting with Pythagorean Theorem, we have
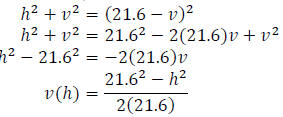
Then, since  , we have
Notice that in order to have A(h)> 0 we need 0 <h< 21.6.
Graphing this function in our calculator, we find the maximum area of 44.9 cm^2,
when the
horizontal leg is 12.47 cm.
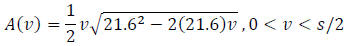
What if we had chosen to write our model for area in terms of the vertical leg
instead?
Then we would write 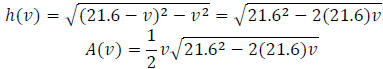 ,and
,and
Of course we still find the same maximum area of 44.9 cm^2, but with a vertical
leg length of
7.2 cm. Notice that while A(h) is simply a cubic function, A(v) is not even a
polynomial;
perhaps something different than what Precalculus students may be used to, and
thus explaining
the slightly different shapes of our earlier scatterplots of A(h) and A(v).
(Notice for A(v), the
“domain of reality is 0 <v< 21.6/2.
An Extension
What if we used a different-sized sheet of paper?
Redo the activity with various sizes of paper and collect data on the dimensions
that maximize
the triangle’s area. Some sample data follows:
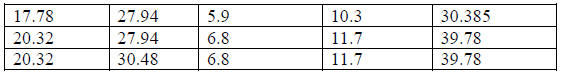
Can we predict the horizontal leg length that maximizes the area from one of the
side lengths of
the paper?
Horiz Leg_max (cm) vs. Shorter Dimension (cm)
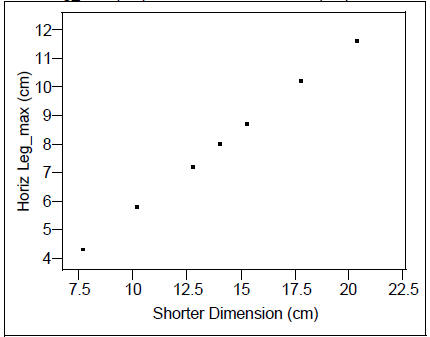
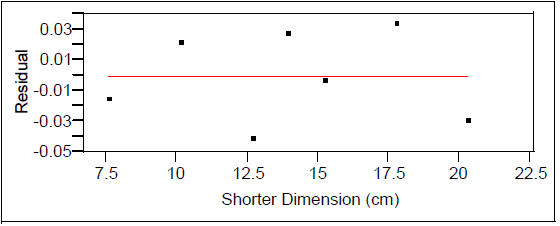
Seems linear; let’s try a linear fit and check the residuals:
Linear Fit
Horiz Leg_max (cm) = 0.0257143 + 0.575928 Shorter Dimension (cm)
Looks good; what if we had tried to predict the horizontal leg length that
maximizes the area
from the longer dimension?
Horiz Leg_max (cm)
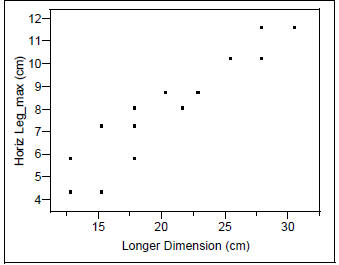
While there seems to be some relationship; it’s not as clearly defined as the
relationship between
the Horiz. Leg length and the shorter dimension.
So if h (x)=0.0257143 + 0.575928s (where h is the horizontal leg length that
maximizes the
area and s is the length of the shorter dimension of the paper) is a good model
to predict the
horizontal leg length, could we also model the vertical leg length from the
shorter-side
dimension?
Vert Leg_max (cm) vs. Shorter Dimension (cm)

Looks linear based on the scatterplot; residuals confirm a good fit:
Linear Fit
Vert Leg_max (cm) = -0.041429 + 0.336333 Shorter Dimension (cm)
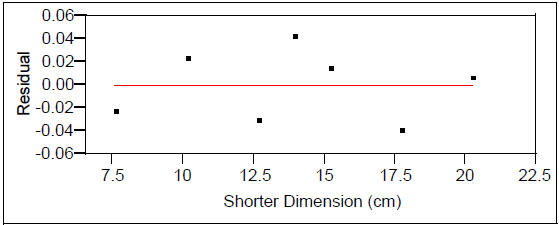
So, we seem to be able to predict the vertical leg length by v(s) = -0.041429 +
0.336333s,
where v is the vertical leg length that maximizes area and s is the length of
the shorter dimension
of the paper.
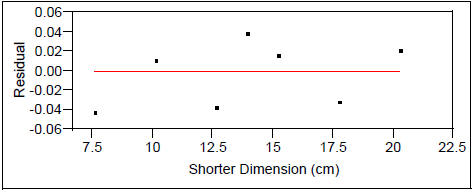
Possible extension:
While the linear models for h(s) and v(s) seem very reasonable; it would perhaps
be
advantageous for h(s) and v(s) to be “forced” to pass through (0,0), since a
shorter-side
dimension of 0 cm would necessarily imply triangle legs of length 0. Then our
models become
h(s)= 0.5776282s and v(s)= .3335938 with the following residual plots: (See
Appendix 2
for a formula for this regression method.)
Horiz Leg_max (cm) vs. Shorter Dimension (cm)
Linear Fit
Horiz Leg_max (cm) = 0 + 0.5776282 Shorter Dimension (cm)
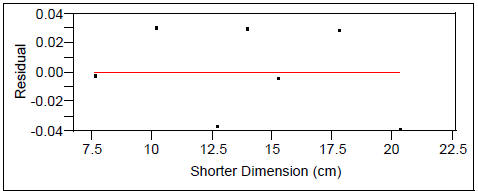
Vert Leg_max (cm) vs. Shorter Dimension (cm)
Linear Fit
Vert Leg_max (cm) = 0 + 0.3335938 Shorter Dimension (cm)
Finally, what if we try to predict the maximum area from the shorter paper
dimension?
Max Area (cm^2) vs. Shorter Dimension (cm)
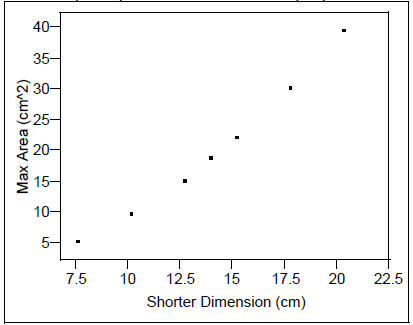
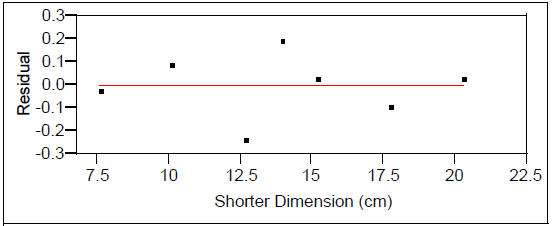
Could a linear model be a good fit? Not when we look at superimposed
least-squares line and the
residual plot:
Max Area (cm^2) vs. Shorter Dimension (cm)
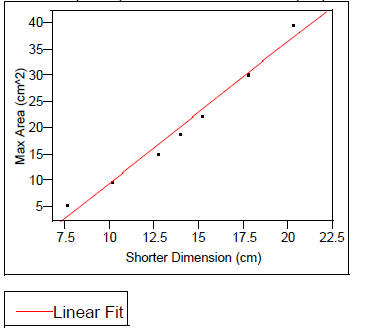
Linear Fit
Max Area (cm^2) = -17.29036 + 2.6948819 Shorter Dimension (cm)
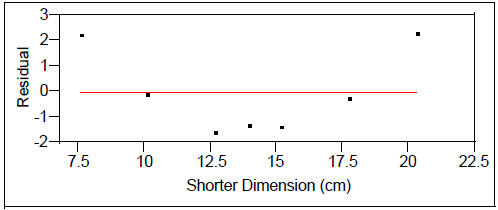
Besides, if each leg is well-modeled by a linear function of the shorter
dimension, then it seems
reasonable that the area should be modeled by a quadratic function of the
shorter dimension:
Max Area (cm^2) vs. Shorter Dimension (cm)
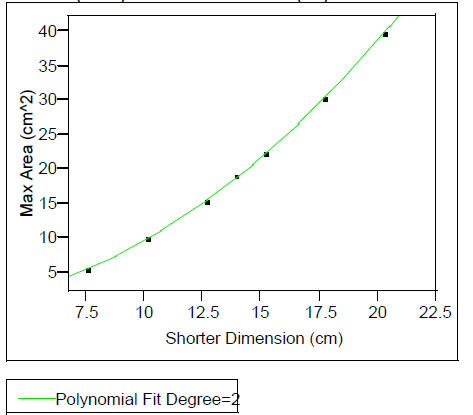
Polynomial Fit Degree=2
Max Area (cm^2) = -18.81004 + 2.6948819 Shorter Dimension (cm) + 0.0942202
(Shorter Dimension (cm)-13.97)^2
Alternately, we could use re-expression to find a model for the area as a
function of shorter
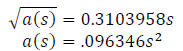
dimension. Since we think quadratic is a good model, we can take the square root
of the area:
sqrt(max area) vs. Shorter Dimension (cm)
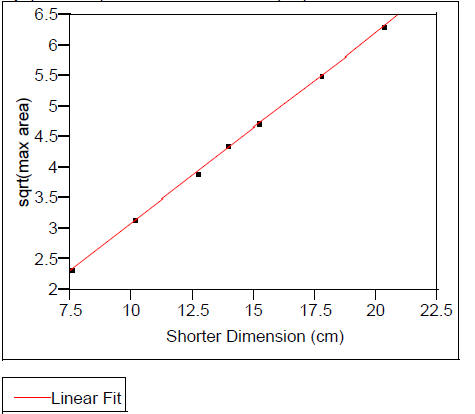
Linear Fit
sqrt(max area) = -0.012407 + 0.3112161 Shorter Dimension (cm)
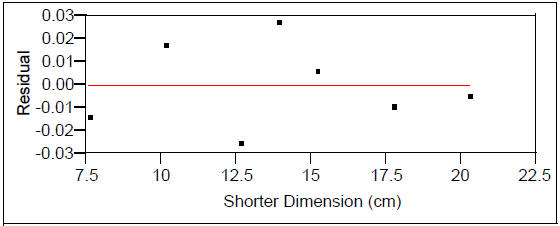
When we write our model back in terms of the maximum area, we have:
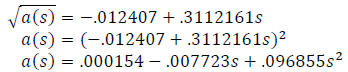
(where a(s) is the maximum triangle area for a sheet of paper with shorter
dimension s).
Again, as a possible extension, we might “force” our linear model through the
origin (since it
makes sense that a shorter dimension of 0 cm would imply an area of 0). Then our
model would
be:
Calculus method
Earlier we had
as a model to predict the area, A, as a function of horizontal leg length, h.
Noticing that the
“21.6” is simply the shorter dimension of the sheet of paper (in cm), we can
make our solution
more general by writing
where s is the shorter dimension of the sheet of paper. (Notice that, as we
observed earlier, the
maximum area is dependent only on the shorter dimension of the sheet of paper,
not the longer
dimension.)
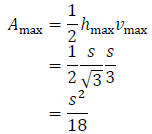
Then we can find the value of h that maximizes A as follows:
Setting  we have
 , so
, so  .
(An easy check with the 2nd derivative
.
(An easy check with the 2nd derivative
test verifies it is indeed a maximum.)
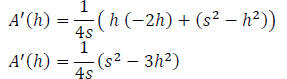
Alternately, if we had chosen to work with
instead, the algebra is slightly more challenging:
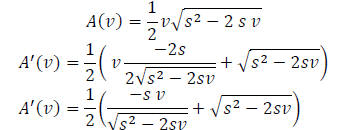
Then setting  we have
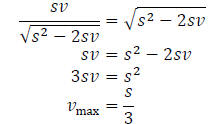
Since  and
and  ,
it therefore follows that
,
it therefore follows that
Appendix 1
Excerpts from a sample student handout:
Triangle Problem Writing Assignment
o Write alone, but you may consult with others in your group.
o Characteristics of your paper:
o It should be “self-contained”, meaning that you could mail it to a friend back
home
who knows the math you know, and s/he would be able to follow your thinking.
o You can do it all by hand, or type the words and do the rest by hand, or learn
MathType and do the equations in a Word doc also.
o Include your name and the names of your pod-partners, a signature (which
indicates
that you were academically honest in doing this work), the name of the
assignment,
the date handed in, and your class block’s letter.
o The paper should contain:
o A description of the problem. (If you decide to take the description of the
problem
word-for-word from the handout, you must cite the source.)
o The “data solution”, which should include (with words wrapped around them, of
course):
 The actual data, including units
A scatter plot (with axes labeled with words
and a scale)
An answer, as an ordered pair and in words
o The “algebra solution”, which should include:
Identifying your variables
The work leading up to your model
The model
A sketch of the model over the domain of
reality (and why that is the D.of.R)
An answer, as an ordered pair and in words
o A comparison of the two answers
If you want to say more (like, what you got by punching “magic buttons”, or
looking at the
relationship between base and height of the triangles), feel free
Appendix 2
Linear Regression with a “forced” intercept at 0.
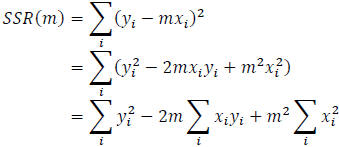
The goal of regression is to minimize the sum of the squares of the residuals.
We start with
ordered pairs  and the linear model y=mx.
Since a residual is “actual y” – “predicted y,” each residual can be written as
 . So we set
out to minimize the sum of the squares of the residuals, or
To find the value of a that minimizes SSR(m), we take the derivative with
respect to m:
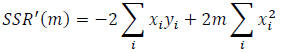
Setting the derivative equal to zero, we have
therefore
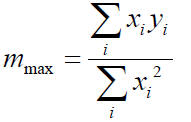
gives the slope of the line through the origin that minimizes the sum of the
squares of the
residuals.